AI Training Data 101 Guide: Derivative/Signal Data
- BCMstrategy, Inc.

- Jan 7, 2025
- 7 min read
Updated: Jul 11, 2025
2025 is the year when data buyers and vendors become serious and discerning regarding AI training data. The proliferation of quantitative and language data used to train a range of AI models for expanding use cases may also generate confusion as buyers attempt to distinguish among different kinds of data.
And so we start 2025 by providing an AI Training Data 101 Guide.
The first post in this series discussed Foundation (Volume, Velocity) Data.
Today's post discusses Derivative/Signal Data (averages, volatility, momentum, correlation, sentiment).
The next post will discuss Synthetic Data

AI Training Data 101 -- Derivative Signal Data
Derivative Data delivers descriptive information about how data behaves within individual datasets. It is most often characterized as "signal" data because the calculated field provides insight regarding repeatable observed dynamics within a defined time period. Derivative data is always analytical data. It is also objective (at least initially) because it describes patterns and relationships inside datasets. It has a higher value than foundation data because it is both actionable and dynamic.
Foundation data provides basic inputs or raw materials predictive analytics and generative AI to support pattern-matching activities that can anticipate outcomes, often premised on a bell curve distribution. Domain experts intuitively know what questions to ask the data. Domain experts that generate and use data therefore have a significant operational advantage relative to others that rely only on traditional analytical processes.
AI models make it possible for non-experts to spot dynamic signals from datasets. They can instruct AI processes to spot patterns and, thus, generate derivative signal data as part of their internal operations. However, the process is neither magical nor efficient. AI systems using new datasets for the first time often operate a fishing expedition which expends compute resources and time.
AI processes may be more efficient than humans when exploring a new dataset, but the real advantages and efficiencies arise when domain experts are in a position to craft the initial signal data because they effectively teach AI systems based on decades of knowledge and experience rather than rely on tabula rasa AI systems to perform data discovery.
Incorporating domain experts from the beginning when generating derivative signal data also accelerates the capacity for automated AI agents to illuminate quickly previously under-appreciated or unknown relationships and anomalies across disparate datapoints, accelerating the capacity of both humans and machines to anticipate outcomes based on past behavior patterns.
Four main types of derivative data exist: Averages/Bell Curve Distributions; Volatility/Rate of Change; Correlations, and Momentum. A fifth type of derivative data exists regarding language data; sentiment or intentionality.
Data vendors with deep domain expertise can -- and should -- supply these higher value calculated fields to their customers. They should also provide their customers with higher value licenses that permit customized parameterization to fit specific internal models.

Averages: The most basic analytical mathematics toolkit enables identification of bell curve distributions for any given dataset. Data visualizations help humans understand where the center of gravity and the tails of the distributions might lie.
Not all average-based analysis uses a Bell Curve construct. For example, capital markets use sophisticated Moving Average Convergence/Divergence (MACD) models to identify market pricing anomalies that can signal profitable buying and selling opportunities even in the absence of company-specific news. The moving average illuminates when price behavior is departing from historic averages.
Because the patented PolicyScope measurement process measures volume and velocity (not word counts) in the public policy process, the quantitative data makes it possible to apply MACD analysis to identify the center of gravity for any policy issue. MACD analysis illuminates when momentum is building (or dropping off) regarding any given policy issue. Consider the MACD calculations using PolicyScope data from 2Q2023 (the red and blue lines depict MACD calculations with two different time horizons:

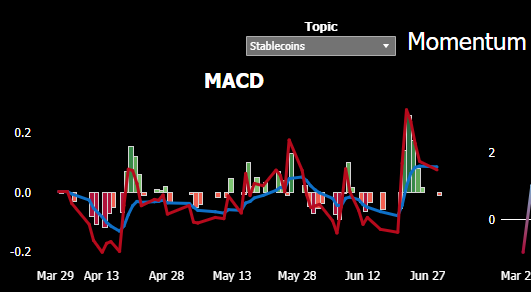


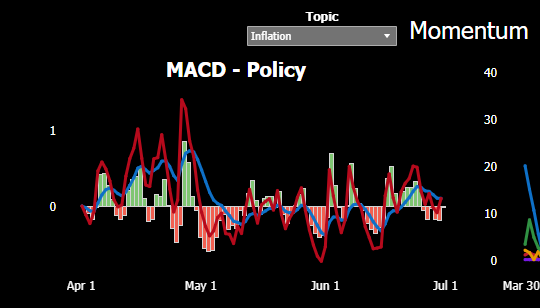
As discussed below, the MACD analysis for public policy language also facilitates identification of correlations and covariances with the price of any tradeable asset on an apples-to-apples basis.

Volatility: Human activity (particularly public policy activity) does not always conform to the bell curve. It is not always linear. Outcomes that exceed expected values, whether at the tail of a distribution or outside the tail, are labeled volatile because they are by definition unexpected.

With all governments in the G7 except Italy experiencing a change in government. volatility regarding public policy choices relative to 2024 will be high. Since the new governments also span the ideological spectrum, volatility across decision-making in key verticals like trade policy, climate/energy policy, stablecoins policy, and CBDC policy will be extremely high during 2025. For more details, please see our July 2024 blogpost.
Volatility is a derivative value. It compares a current volume measurement against a previous volume measurement. The difference, or delta, between the two values delivers a measure of volatility. Volatility can be expressed as either a positive or a negative value relative to a previous period. Large positive volatility values in the capital markets can be used to express "upside risk" which provide perspective on the amount of unanticipated improvement in asset values (and, thus, lost profit opportunities).
Human language is also volatile, of course. The large range of expression and the embedded emotion in vernacular expressions, particularly on social media, can complicate considerably any effort to measure lexical volatility.
Transforming the language of public policy into foundation volume and volatility data makes it possible to generate derivative volatility measurements that illuminate which policy issues are on the move. The multivariate time series data generated using the patented PolicyScope process also supports data-driven analysis of how policy volatility differs between the news cycle and the policy cycle, contributing to next-generation early warning signals regarding policy shifts in advance of the news cycle.
Applied to public policy data, volatility calculated fields deliver a visual and quantitative mechanism for identifying where policymakers are most active even when media coverage points to a different direction.

Correlation: Life is complicated. Reaction functions exist. Foundation volume and velocity data make it possible to measure whether and how much two (or more) entities react to the same impetus.
AI processes excel at finding previously unknown correlations (where to items move in the same direction in response to an external impetus) and covariances (where two items consistently move in the opposite direction in response to an external impetus).
Because the patented PolicyScope process provides volume and velocity data derived from the language of public policy, for the first time data scientists can calculate correlation/covariance matrices regarding public policy.
It is now possible mathematically to do what public policy professionals have been doing for hundreds of years intuitively based on their knowledge of the policy process and the language used by policymakers: we can now measure, observe, and anticipate reaction functions....and, thus, policy trajectories....using AI processes.

Momentum: Momentum measurements express trajectories mathematically. Whether calculated as an average or as a volatility (or other) value, the derivation from foundation data illuminates the direction of travel. Momentum may depart from the Bell Curve, rendering momentum measurements as valuable inputs for anomaly detection.
Humans use trajectory momentum data to create a reasoned view on the most likely outcome. AI agents use momentum measurements to anticipate the most likely outcome. The sophistication of the trajectory trend projection process depends critically on the underlying model architecture to estimate reaction functions using assumed or derived correlation/covariance values.
Data vendors seeking to support client use cases that include estimating trajectories and predictive analytics would be wise to incorporate into their data offerings the most relevant momentum measurements based on their particular dataset. The Momentum measurement adds value to the dataset and to the client. Importantly, for new kinds of foundation data that have never been used before, including a momentum measurement can provide a reference point that accelerates customer understanding of how to use the data.
Our PolicyScope data delivery includes a Momentum calculated field customized to our specific data. We deliver a calculated field that incorporates both measured volume levels as well as measured posture readings. Examples using 2Q2023 data include the Momentum Index for Stablecoins (top image) and the Momentum Index for global Hydrogen policy:

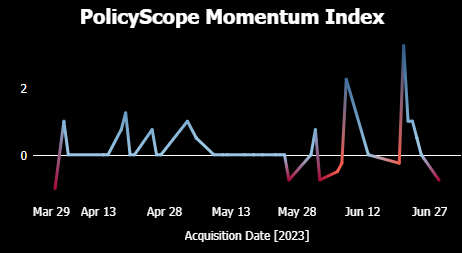

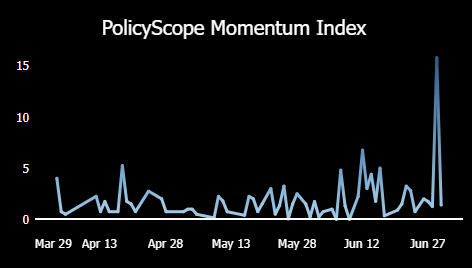
Note that Momentum can be negative (indicated by the red color).
Many at this point will be asking how we measure volume and velocity in policy language without using word counts. Others will be tempted to assume that we are using sentiment analysis. We are NOT using sentiment analysis to measure Posture. But the question does lead us to the last of the five important derivative signal fields. This is the only derivative data point associated exclusively with language.

Sentiment Analysis Data: Sentiment analysis applies advanced language processing and machine learning to identify emotions embedded within human language in order to discern technologically how a speaker feels. The technology illuminates a second layer of communication in human language beyond definition.
At its most basic, traditional sentiment analysis transforms specific words and phrases into emotions expressed as numerical, machine-readable, values. Each phrase receives a numerical value associated with the specified emotion. The process then operates an object recognition function, translating the objects into numerical values for measurement and calculation. The outputs are expressed in terms humans can read: words representing emotions often in parallel with the sentiment 'score.'
Sentiment analysis data can be very valuable when attempting to discern retail customer reactions to brands or specific situations. I can be very helpful in identifying the non-verbal layer of communication when analyzing marketing collateral. However, sentiment analysis is problematic and often useless in the public policy context.
The language IS the data in public policy, but that does not mean that emotion is the right metric to assess policy posture much less trajectories.
Policymakers articulate their intentions using a range of verbal and non-verbal cues. They often use emotion for a purpose other than to communicate their intentions. Sentiment analysis conflates sentiment with intention. At BCMstrategy, Inc., our PolicyScope data distinguishes between emotional sentiment and actionable intention. Our derivative signal data illuminates the pulse of the policy process daily and objectively
The last and final post on training data will focus on synthetic data.
BCMstrategy, Inc. generates training data for a broad range of AI-powered analytical tools related to public policy. From policy trend projection and automated market reaction function forecasts to generative-AI automated research agents, our patented, award-winning process delivers informational advantages and operational efficiencies to strategists focused on global macro (including monetary policy, trade policy, de-dollarization policy), climate and energy policy, and digital currency policy (including tokenization, blockchain, CBDC, stablecoins, and crypto).